Many of us who work with commercial and industrial facilities are familiar with utility programs that pay cash incentives to encourage energy efficiency projects. The more energy you save from an eligible retrofit, the more cash incentive the utility will pay you—usually with a cap at a certain percentage of the project cost.
The rules for incentive payouts change, however, when your facility has onsite electrical generation, such as solar PV, cogeneration units, or fuel cells. In California, the incentive programs are designed to encourage reductions of electricity supplied from the grid, not electricity supplied from your onsite generator. The same principles apply for incentives from California’s Savings by Design program for new construction of nonresidential buildings.
Your utility will calculate your incentive based on the “claimable savings” from your project. The claimable savings consider only reduced electricity imports from the grid, not the total energy savings from your efficiency retrofits. I have seen projects where the claimable savings were as low as 29% of the energy savings delivered by the energy efficiency projects, and the incentive was reduced significantly due to onsite generation.
The impact of onsite generation can change the economics of your energy efficiency projects. Be sure your project team understands the details when developing budgets and evaluating the cost effectiveness of efficiency retrofits.
Two Approaches for Calculating Claimable Savings
The California Public Utilities Commission (CPUC), which regulates California’s investor owned utilities (IOUs) and determines how ratepayer money is spent on energy efficiency programs, has a guidance document for calculation of eligible savings for projects with non-IOU supplied energy sources (e.g., onsite self-generation).
In the CPUC guidance document, which California IOU incentive programs adhere to, there are two approaches for calculation of claimable savings:
- Facilities with solar PV onsite generation
- Facilities with onsite generation other than solar PV
CPUC requires that facilities with solar PV provide a monthly grid impact analysis to determine claimable savings. Facilities with other forms of onsite self-generation are required to provide an hourly grid impact analysis.
The requirement for an hourly grid impact analysis is consistent with the principal goal of California energy efficiency programs, which is to reduce investments in the expansion of supply-side resources (i.e., the building of new power plants), and it has been a CPUC energy policy requirement since 2006. The exception granted for facilities with solar PV—which are required to submit only a monthly grid impact analysis—was enacted to support California’s Zero Net Energy goals which encourage the adoption of energy efficiency and onsite solar PV.
Approach #1: Facilities with Solar PV Generation
The claimable savings for a facility with a net energy meter and onsite solar PV are capped based on an analysis that considers the facility’s monthly direct imports from the grid and the monthly savings from energy efficiency measures. The claimable monthly energy savings are capped at the amount of direct electricity imports for each month.
For example, suppose your facility has solar PV and your electric bill revealed the following for the month of July:
| Electric Import/Export Summary for July (kWh) | ||
| Exports | Imports | Net Imports |
| 15,000 | 10,000 | -5,000 |
Note that your facility exported more than it imported from the grid, meaning that you were a net exporter for that month. Put another way, your net imports were negative, meaning that you sold more electricity to the grid than you bought from it.
In this case, if your project is estimated to save 12,000 kWh during July, the claimable savings would be capped at 10,000 kWh. If your project were estimated to save 5,000 kWh during July—under the cap of 10,000 kWh—then the claimable savings would be 5,000 kWh.
This same analysis would be conducted for the remaining 11 months of the year, and your utility would then calculate its incentive based on the annual claimable savings. This is a generous methodology because you do not know that the energy savings occur at the time of electricity imports. In other words, you do not know the extent to which your energy efficiency projects are reducing load on the grid.
Approach #2: Facilities with Onsite Generation Other than Solar PV
For facilities with onsite generation other than solar PV, an hourly analysis is required to show how your energy efficiency projects impact your facility’s demand on the grid. Thus, it is necessary to obtain 15-minute or hourly interval data for your meter and to develop an annual hourly profile of the energy savings from your projects. With this data, the claimable savings can be calculated for each hour of the year. The table below shows the first ten hours of an annual hourly analysis.

Note that the energy efficiency measures are operational and saving energy during all ten hours, but the facility is importing electricity from the grid during only two hours of the ten-hour sample. It is during these two hours—highlighted in yellow—that claimable savings accrue. Because the facility is exporting to the grid during the other eight hours, the energy savings during those hours are not considered claimable.
Also note that when the facility is importing electricity, the energy savings exceed the electricity imports. Therefore, the claimable savings are capped at the amount of direct imports. For example, between 7:00 and 8:00 AM, the energy efficiency measures are delivering 140.3 kWh of savings, but because the facility imports only 58.9 kWh at that time, the claimable savings are set at 58.9 kWh.
This same analysis would be conducted for all 8,760 hours of the year to determine the annual claimable savings and calculate the utility incentive.
Visualizing the Impact of Energy Efficiency Measures on the Grid
Consider a food processing facility which has onsite solar PV and a fuel cell and is planning on implementing several energy efficiency measures. Because some self-generation comes from a non-PV source, an hourly analysis is required to estimate the claimable savings for the energy efficiency projects at this site.
Figure 1 shows the facility’s existing net meter demand (dotted blue line) overlaid with the proposed net meter demand once the energy efficiency measures are implemented (dotted orange line). The positive values represent electricity purchased from the grid. The negative values represent electricity exported to the grid. Note that the proposed net meter demand, which models the hourly impact of the energy efficiency measures, significantly increases exports to the grid.

Figure 1: Before & After Net Meter Demand for a Food Processing Facility
The energy savings—or reductions in facility energy use—are measured as the area between the existing and proposed net meter demand profiles. (This is true if the hourly output of onsite generation remains constant for the existing and proposed scenarios.) The claimable savings are measured as the area between the two profiles that remain above the x-axis.
Figure 2 shows the the existing and proposed profiles over half a day with the area representing claimable savings filled in with red. This area represents the reduction in the facility’s electricity imports seen by the grid.
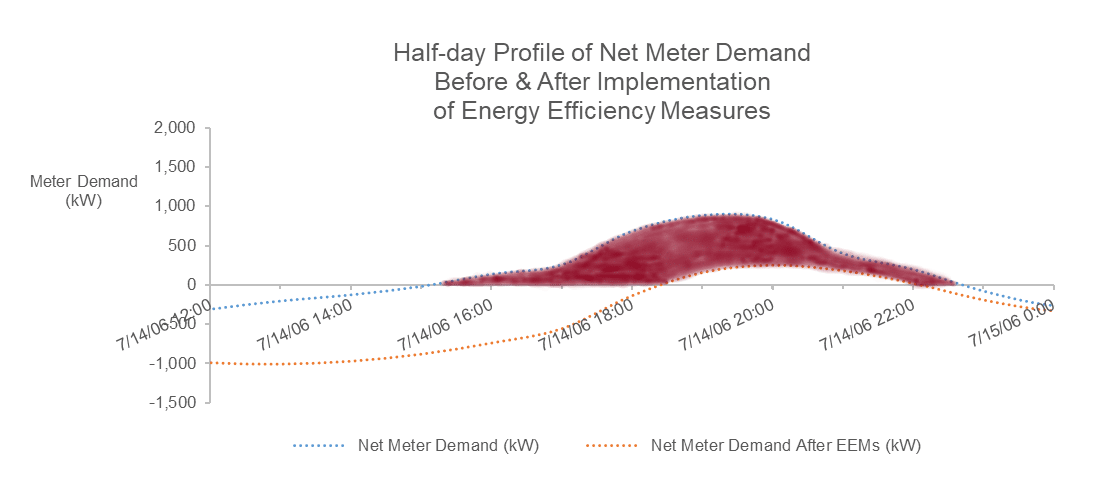
Figure 2: Claimable Savings Shown Over a Half Day
Note the wide gap between the existing and proposed net meter demand profiles that occurs under the x-axis. This area represents savings that result in increased exports to the grid. Therefore, these savings are not eligible for calculation of utility incentives. The extent to which the facility can enjoy cost savings during this period will depend on its electric rate structure and the cost of its onsite generation.
Quantifying the Difference Between Savings and Claimable Savings
For the food processing facility example above, the claimable energy savings—estimated with the hourly grid impact methodology—amounted to only 34% of the total energy savings from the energy efficiency measures.
Not all facilities with onsite generation have such a wide difference between project savings and claimable savings. Recently, I reviewed an analysis of a municipal wastewater treatment plant which burned digester gas in a cogeneration unit to produce heat and electric power. Because the facility had a significant amount of direct electricity imports during each hour of the year, even when the cogeneration unit was producing electricity, the claimable savings were nearly 100% of the savings from the energy efficiency projects.
Conclusion
If you have onsite generation and are planning energy efficiency projects, make sure your analysis of the economics includes accurate estimates of the utility incentives. The gap between savings and claimable savings can be dramatic. By knowing the difference, you can more accurately assess the cost effectiveness of your energy efficiency projects.
If you have questions about incentives for your facility, contact us anytime.
Like this post? Share it on LinkedIn.