
You can evaluate energy performance and target energy saving projects using graphics like in the case of one of our portfolio clients where we evaluated lighting control system performance looking at lighting power density (LPD) and energy use intensity (EUI). Data visualization is one of the easiest and fastest ways to compare energy use among buildings. We used lighting control system reports and Google Sheets to aggregate and manage data streams in a centralized, transparent, and maintainable document to track successes and overcome stumbling blocks.
HOW DO YOU EVALUATE LIGHTING ENERGY USE?
There are different metrics you can use to compare energy use. This customer was particularly interested in how more recently constructed buildings compare to lighting systems in older buildings. One building has LEDs, three buildings have T5 lighting – all four buildings have networked lighting controls. They were interested in gaging the energy performance against energy code and the cost it takes to get to a high-performance lighting system.
WHAT IS LIGHTING POWER DENSITY?
Lighting power density is defined as the watts of lighting per square foot of floor area (W/ft2). In most lighting projects, the maximum LPD is defined by code (e.g. Title 24 part 6 or ASHRAE 90.1). These LPD allowances are determined by panels of experts who assess lighting requirements (generally illuminance targets) and current technologies to provide lighting designers an ‘energy budget’ for new construction. Thus, spaces that typically require more lighting (e.g. assembly lines) are budgeted more energy than space that are not quite as brightly lit (e.g. a corridor).
For this customer, we were interested in, achieved LPD, or the lighting power density of the lights as they were installed. Achieved LPD ignores the budget implications and instead focuses on the reality of the project. This captures tenant-improvements, with additional or substituted luminaires were installed.
WHAT IS LIGHTING ENERGY USE INTENSITY?
Energy use intensity is the energy use of a building divided by square feet (kWh/ft2). Lighting EUI reports how much energy is used for lighting per square foot.
To capture the lighting EUI, we used the lighting control systems to report the lighting energy consumption for each building as a function of time. We analyzed approximately 18 months of data and normalized the data to a single, 12-month period.
COMPARING CONTROLLED LIGHTING ENERGY USE
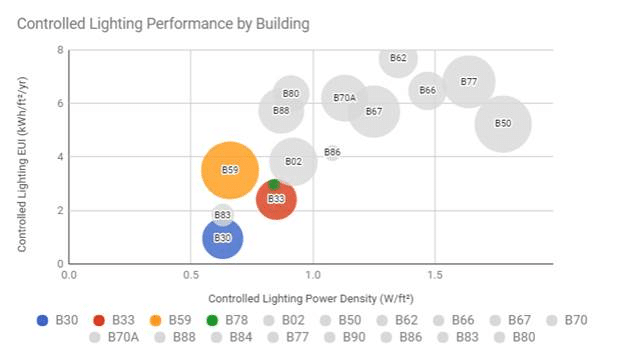
Using Google Sheets, we plotted installed lighting power density on the x-axis versus actual energy use on the y-axis on the chart below. Since our EUI data comes from the lighting control system, we only considered the building-level LPD of lighting controlled by the lighting control system. . The size of the circle correlates to the building area controlled by the lighting control system.

You can see Building 59 (B59), which is our client’s newest building, has a pretty low LPD (W/ft²), but the normalized EUI (kWh/yr/ft²) of lighting is the highest (~3.5 kWh/yr). The size of the bubble reflects the size of the system. It is about 120,000 ft² while Building 78 (B78) is about 4,400 ft². It shows that LPD means much when you don’t control it well. Building 30 (B30) has a similar LPD, but the EUI is about 3.5 times lower!
Lighting power density is not a key predictor of energy use. So this chart indicates there is greater potential to save energy through better control sequences rather than focusing on lighting efficacy improvements.
In the second chart, we wanted to show the analyzed buildings in the context of other buildings where we did lighting analysis work (either audits or scoping the site for lighting retrofits). To de-emphasize these less well studied buildings, we turned the bubbles grey.
Our client “just love[d] this visual. It tells the entire story.” These charts demonstrated the potential energy performance of new lighting systems with advanced controls and served as motivation to not settle for a minimally specified/programmed new lighting control systems.
This visual is powerful because it shows relative performance and likely buildings to retrofit like Building 77 (B77) and Building 50 (B50). Both are high on the LPD, and EUI. B77 has 8’ high output T8 lamps and very little zoning and B50 is a hodge-podge of administrative offices, labs, data centers, and assembly spaces with old, inefficient fluorescent luminaires. As outliers on chart it’s clear these building are prime candidates for retrofits.
A PICTURE CAN BE WORTH A THOUSAND DOLLARS OR MORE
The right picture can quickly and effectively target buildings and systems that are costing you money. Even the most sophisticated control systems can cost you if they are not programmed and zoned properly. Spending time looking at energy use is a worthwhile investment. Whether it’s ensuring your systems operate as intended or require optimization, you can rest assured monitoring your energy use will pay dividends over time. If you need help managing your energy use contact us anytime.